Sunday, August 21, 2011

Why you shouldn't try to become the perfect trader

I've been going through historical data in the Dow Jones recently to try and better understand past trends. I've mentioned before that I generally try to stay away from technical analysis but I've decided to put away that hat and decided to see where this takes me. The one good thing that looking at historical data is understanding the scale for change, things are measured in months and years instead of days and hours. I have a terrible habit of looking at daily market data, thinking that motions in the day are indicative of where things are going to be in the long term. So I'm going to stop looking at the market like that (though it can be fun sometimes... sort of my equivalent of "watching sports").

I've simply started plotting through the Dow Jones looking at annual returns year by year. Looking at annual returns is a really arbitrary thing to do since I am picking a price at some "random" date and comparing the ratio of it to some other date in the future. I am sure that picking different windows will have different values but what else am I to do, eh? Not a whole lot until I figure something out, but for now this is it:

I've grabbed annual data back till 1971 and the funny thing about looking at 40 years or annual data is that there is so little data to look at. The first thing that pops out at me is the all negative change years occur after a +10% change year (though not after all 10% years). The second thing is that 5 out of 7 negative years turn positive the year after. So what would you do in this case? One could surmise that it might be a good idea to take out some money after a +10% year and put it elsewhere as a contingent against a negative year (Ie. Bonds or something). The next thing is that you might once a negative year occurs, you have a good probability of catching a positive year after a negative year. Something like that could work but the problem is that you will still need to optimize against having 2 consecutive bad years. There is also a period in the 1990 where there was nearly no negative growth years, but let's say that you've optimized your strategy to factor that in too.

Now suppose that based this 40 years of data you've made a fairly optimized portfolio where you take a small chunk of money during good years and put them into bonds when you make more than 10% when the new year hits and made a rule that if there is a negative year, that you would plunk (say) about 60% of the money you had in bonds into the market during a bad year to catch the probability of a good year the year after and it left you with enough funds to deal with 2 consecutive bad years you could leverage yourself since the probability of having 3 bad years according to this data is zero (the alarm bells should already be going off here).

Suppose that this strategy worked well against this data, you might be fairly tapped out if there are 2 consecutive bad years and the strategy provides for very good gains. Unfortunately, if you look far back enough in history, there is a period right after 1929 where there was 4 consecutive bad years. If a black-swan event like that happened, everything in your portfolio would be gone. Unlike poker, you don't generally have "rebuys" in the stock market (unless you have really rich and possibly foolish relatives), If you're going to want to play this for the long game, developing a methodology to understand what is going on around you, knowing your options, knowing your limits and knowing what exactly you are willing to risk is important. Having good well founded rules to maximize your success are important and you should, in general, play by self set rules that are designed to maximize your chance of success (and though, just like poker, success isn't guaranteed). And just as a note, there are 4 years of consecutive negative growth around 1929 that might have wiped this strategy out (then again, it probably wiped out nearly everyone during that time). In addition, you may want to have a contingency to catastrophic events.

I had this knowledge internalized in me in poker so well that I had forgotten to be aware of my general rules that made me a generally strong player. Most of my poker playing rules were also mathematically generated too, the game of poker (un)fortunately is really easy to analyze. All you need is some general understanding of probability, expected value calculations and knowledge of permutations and you pretty much had it made. The stock market is different and choices and information is so much more vast such that it nearly impossible to understand the entire system... though I still do try (though I am off on a tangent).

Rule number 1, though, it to have a set of rules to play by and more importantly, have a set of mental interlocks to prevent yourself from going "tilt." Getting into the stock market will make one incredibly emotional. A bad stock market period is like PMS for men (that is not to say that only men participate in the market) and you honestly need to get a hold of yourself during those time because you are going to be prone to doing stupid things.

This coming of the second crash (?) has given me a great opportunity to better look in to and handle crashes. The first stock market crash that I have ever had to have deal was the 2008 one, and my, that was a doosie. I wished I was old enough to have participated in the 2000 dot com bust, because I would have been much younger and had a lot less money to lose. Unfortunately, I was too young and had very little real capital to my name during that time (and the cost of trading was way too expensive during that time; $29 for a single trade!). Anyways if/when I do have kids, I am giving them money to blow in the stock market, they might as well learn to lose everything early and fast (and I hope to not make chronic gambling kids while at it too).

Fail Safe (avoiding gambler's ruin)

Unlike other games, the stock market is the kind of game where you play on one "life." The idea that you're supposed to be in the market till about 65 ish (or longer) and not screw up and lose nearly one thing is actually daunting. It's like pretty much saying that for 30-40 years that you are not allowed to fuck up. But that is pretty much it, lose once in the middle of it and you are possibly screwed.

I've come to the realization that optimizing for gain and building a robust portfolio are (to me at least) opposing factors. Optimization is basically trying to allocate resources perfectly to come out with the most perfect result as possible (which is easy in games, hard in real life) because it can equate to doing things with minimal margin for error and going for possibly unrealistic perfect results. When it comes to investing, you are never going to get the most of that up swing, nor are you going to know when the market has hit bottom. The question is not a matter of making the perfect play (because it is impossible), can you make decisions such that are "good enough"? The next important thing is that can you make consistently make "good enough" decisions? Because if you can, then you are on your way to becoming a good investor and I think this is often an overlooked point.

The important thing about investing is being able to quantify the risks of every decision that you make and have a general idea of what you are going to do if things turn bad. How much loss are you willing to take? if losses do occur, are there other assets that can balance against that loss? Is the portfolio setup in a way that you won't be psychologically affected if things go to bad (or good?). Risk quantification in a portfolio is really tough and it is a really fuzzy science but it is very necessary. One of those lessons learned from my crazy crash and burn in 2008.

How am I faring?

I think I was lucky this time because I wasn't overly invested in equities and though the equities that I did hold lost a lot of value, I am sleeping better compared to last time. The other thing I should note was that I was a little impatient in getting back into equities a few months ago when it seemed to me that things were going to start taking off. The equities that I did end up buying were over priced because I thought things were going to be a little better than they currently are right now. I should have been more patient but that is the way how hindsight works.

I've also thankfully kept a good amount of cash out of the markets and will be patient for things to cool down in the market before looking at getting back in. The volatility will be here for a few months until Europe sorts it self out and people get over the S&P downgrade of the US (which ironically, did something good for US treasury sales). There will be plenty of sucker rallies and swings coming up... but then again, that is already pretty normal for the stock market.

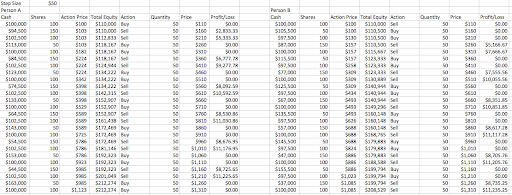
If you can make sense of the following data, then you deserve to be a millionaire.

Tuesday, August 16, 2011

A look at some past crashes

I had some spare time over the last few days so I've been going through some of the Dow Jones historical data with some programs to study volatility during some previous stock market crashes. I first plotted out daily percent changes in price and volume to look for large swings in price and volume. The result of that plot is provided below:
Looking at the percent change in stock price, it become fairly easy to pick out periods of time of high volatility and we see a few points in 1987, 1989,1997,1999-2003,2008-present. By the looks of the graphs, it takes a few months until volatility subsides. Though as of today, it seems that the stock markets are up, I highly doubt that the choppiness seen in the Dow last week will be the last.

The % change in volume plot doesn't capture well changes in volume since it could simply mean that volume could have suddenly risen and remained constantly high during a crashing period. Though from the plot, we do see that volume can vary quite wildly.

Given the % change in Price plot for the Dow Jones, I had a program go through the data looking for points in time where a > 5% decrease in the index occurred and extracted 4 months of data before the crash and 6 months after the crash to get about 10 months of data. I also had the program mark points where a > 5% decrease occurred and came out with 7 plots:
US Debt Down grade Crash

The data seems to indicate that during the pre-2000 eras of crashes, volatility was far lower compared to what we are seeing in the markets now. This is probably the result of the HFT algorithms going at it in the market place. The most recent crash is showing far more volatility compared to all but the 2008 stock market crash as we have seen in a single week, some very large price movements in the Dow Jones Index. There was also a large spike in trading about a week before volatility picked up and I am not sure what this represents.

Not really sure where the volatility is headed from here, but there could be more on the way if things this time around play out in a similar way to 2008. We'll have to wait and see I guess.

Thursday, August 11, 2011

Where does "net worth" go during a stock market crash?

Understanding your "opponent's" trading account is akin to keeping track of the number of chips your opponents have during a game of poker-- the amount of cash your opponents have will have an impact on the way they play the game.

One thing about stock market crashes that fascinated me is trying to understand where the money and capitalization value goes. I have been working over the idea of the existence of "phantom capitalization" in the stock market as a result of stock prices being bid up and I was interested in trying to understand the mechanics of a stock market bubble. So I was basically trying to model a feedback loop were people start pouring more and more money (and leverage) into the stock market, thus creating the illusion that everyone has more equity via "phantom equity." The process repeats until it is unsustainable and things fall apart.

I believe that there is a disconnect with this mode of thought since people are fooled into thinking that this equity is real and the harsh reality sinks in when the inflated stock prices tumble which wipes people out. The real objective of participating in the stock market is to buy and sell stocks to eventually cash out with more money than you started. By playing by any other rules instead, I would argue that the investor is fooling themselves when participating in the stock market. Unfortunately, the calculation methods used to value equity is somewhat faulty and is prone to enticing people into inflating stock market bubbles.

The first thought that came to mind was to try and simulate players and their interactions in the stock market; trying to understand the impact of their buying and selling of equity and how it would look like in their trading accounts. Obviously, this is a pretty hard problem as the real stock market has many individuals and tradable securities. Going for the full monty is obviously too complicated so I decided to sandbox the whole issue and have 2 players with cash and a single tradable stock which both players owned at the beginning. When one player issued a buy order, the other had to sell at the same price and volume and by using this simple model, I wanted to see what a stock bubble would look like under this isolated situation.

I managed concoct a trading pattern between 2 players where they could buy and sell and equity at increasing prices while keeping the amount of money and the number of stocks they had on hand constant. However, through the act of trading and using the standard method of calculating the "average action price" of each person, I was able to inflate the price of the stock and thus was able to create phantom equity for each individual. I have included a screen shot of the simulation I performed in the image below (click for the full sized image).

In this rather simple simulation where I kept the volume constant, I noticed that the swings in the "cash" column got larger and larger as the price the stock increased. In more realistic situations, I would presume that the volume would taper downwards to reduce such large swings in one's capital account. I would surmise that this also wouldn't apply to just individual investor but is also true for computer systems engaged in high frequency trading. But the main point is that it is possible to observe the inflation of networth of 2 parties trading in a single market and that it should be possible to extend this model to a many people market with many different stocks.

For the above calculation, I didn't take it all the way to the point where both persons were leveraged to continue bidding up the equity price, but it should be quite evident that the swings would get larger until the point where neither person A or B would be able to leverage themselves any further. Supposing that a dormant person C existed, any sell off by this person would result in a catastrophic crash as margin calls are made.

From a technical trading standpoint, I think it would be an interesting exercise to find ways of watching the volume and price as an indicator of bubbles in the stock market. One concept would be to watch for decreasing volume while prices rise as an indicator of a bubble since higher prices will equate to lower volumes as a stock is traded up. I would also expect that the converse be true in that volume would likely increase when stock prices are low since it takes more of the same stock to move the same amount of money.

What I am very interested in trying to figure out as a result of this simple calculation is an empirical method of guessing at the "action prices" of other participants in the stock market. I have a hunch that people will have a tendency to sell off their stocks after turning a profit and will likely end up spending their profits on buying other (inflated) stocks. The whole process continues until a bubble occurs and it pops, leading to the destruction of phantom equity.

One method of making money in the stock market is simply knowing when to get out and staying out when a bubble occurs. And the trick to understanding when a bubble is occurring is figuring out when there is too much phantom equity vs the amount hard cash available.

Tuesday, August 09, 2011

The Unwinding yen carry trade?

The yen is skyrocketing recently against the USD, CAD and the AUD over the last few days. The chart for the JPY vs the AUD is especially astounding as people are unwinding their carry trades. The recent spike is astounding. The other thing, however is that I am quite certain that the rising valuation of the yen is unsustainable against other currencies and there should be a correction happening eventually. The question is at what price and how volitile things will be during this time period.

One thing that I appreciate after coming back from Cambodia and Vietnam is an understanding of the bartering system, where the prices of goods is often bartered between the customer and the store clerk. Prices do vary between shops and it is very interesting to see how prices can be very fluid between places. Everything is driven by the sentiment of the store owner, the customers and other market circumstances and this experience is equally applicable to the stockmarket.

One intersting observation that I made about the merchants that I bartered is that they liked to ask where I was from. Basically, what they were trying to discern is what price would I be willing to buy something by the living standard of the country that I lived in. A Chinese person might price things differently from an Europeian and etc. When it comes to the stock market, instead filtering the buying and selling patterns of people by country, one would need to understand the trading motivations of different financial institutions. Meaning that different people would have different ideas of what a fair price for the same financial instrument.

Anyways, I am very tempted to sell more of what yen I have into other currencies, but the question I am trying to figure out is how long will the sell off in the stock market will continue. I believe that the yen will continue to strengthen the worse things get in the stock market. The question is when will the sell off stop, at what price will people start selling yen and etc. All of this is really hard to figure out.

When it comes to the financial market, one cannot look at companies in isolation but also other traders and their motivations in the market. I have a new appreciation for that and very interested in developing tools in trying to understand the financial conditions of the other players in the market. As in poker, you have to be able to keep track of the number of chips everyone else has because how people play is also dependent on the number of chips they have.

Monday, August 01, 2011

In Cambodia

This is probably out of the blue, but I am in Cambodia right now. My work had a scheduled 1 week shut down of the office and facilities as a result of power conservation efforts in Tokyo. Apparently, companies have a sort of power usage limit between now and until mid-September and going over the power limit will result in fines based on the number of hours a company is over the limit. There are other details but I won't bother getting into them as it will probably detract from the main contents of this post, as in me being in Cambodia.

Dispite backpacking through South-East Asia 3 years ago, Cambodia is one country that was on my list to goto, but I never made it to because of time constraints. This time around, with the 1 week holiday from work I would go and hit Hanoi and Siem Reap to see the Angkor Wat temples. After a bit of a turbulent jounrey from Vietnam to Cambodia (not to mention that they also block facebook there), here I am in Cambodia and I have some pretty positive things to say about the country.

The people are incredibly warm and after getting out of the airport there weren't a bunch of taxis waiting outside waiting to over charge travelers to get into the city. We also had a tuk-tuk (a motorbike connected to a sort of trolley) that waited patiently even as my flight into the country was delayed by 2 hours. Compared to other SE-asian countries, there is a lot less price gouging here; then again, the cost of living here compared to other countries is so much cheaper that even if they raised prices, I might not even notice.

The price for a dish or something from a local stall ranges in the $1-$2 range, a foot massage for 30 mins is $2.5 and a full body massage for 30 mins is $3, just to put things in to perspective. Staying at really nice hotel runs for about $30/day, which is really reasonable. My imagination runs wild with the idea of running off here and not returning to work for simply years while staying out here.

The other nice thing about people here is that they are generally good natured and even if they can't get a sale out of you, they still are nice to you. Which is a rather nice touch. One of the guides I met is only but a teenager but has managed to learn a really good level of Japanese through 1.5 year of study and acts as a guide for many Japanese tourists that come out here. The determination I've seen in some of the youths here is simply astounding.

There is one sad thing that I've felt while being here is that there is a huge influx of tourists in Siem Reap and it feels like that many of them are just here for the cheap thrills of a country with a really low cost of living- there are some people out here that I've see that I would have a hard time imagining getting anything of value from visiting the angkor wat temples and at the same time, it feels a little sad that the locals are doing their best to cater to these people through the creation of bars and restaurants to turn a profit-- a perfectly good environment being ruined by the influx of money through the western world... and that was probably the most profound insight I had while walking around the city today. I took a bunch of photos, but haven't had the chance to download and sort them yet. Hopefully, I'll have some time to do so later on.